Demo
About
Light
Dark
Automatic
Data Visualization
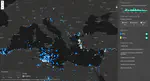
Migrant Map
An interactive map to tell the drama of the stories of the migrants involved in the tragedies occurred during the migratory flows of recent years
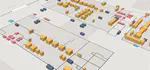
Tannery plant digitalization
Tannery plant control by means of an interactive digital twin
Grafana Server Monitoring
Real time server monitoring through Grafana dashboards
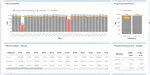
OEE Dashboard
Visualization of efficiency indicators for a paper production plant
Tweetmood
Tweet sentiment analysis for the 2018 general elections
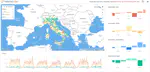
Geo-Indicators Visualization
Geospatial platform to predict the market value of city areas using socio-economic variables
Cite
×